For personal, non-commercial use only!
Contact us if you need a license for use in a corporate environment or for commercial purposes.
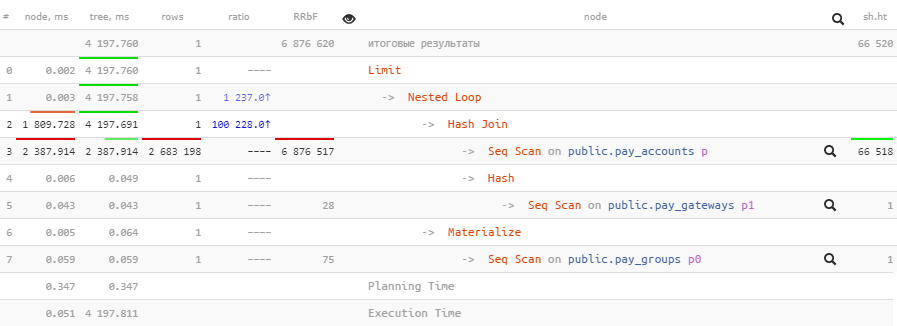
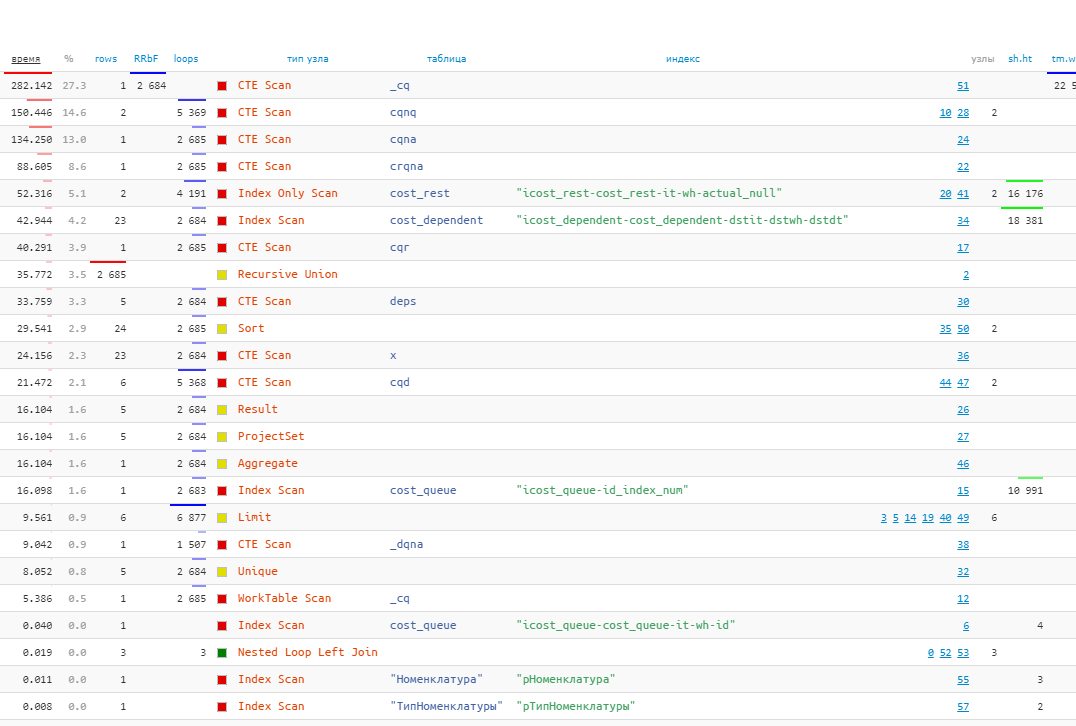
The shortened plan tree makes it easy to see the query execution algorithm, its numeric indicators are displayed separately and accentuated with color marks in proportion to the load.
Summary statistics of nodes allows you to analyze plans of tens of thousands of rows in aggregated form sorted by any indicator: execution time or read from disk, the amount of data received from the cache, or the number of filtered rows.
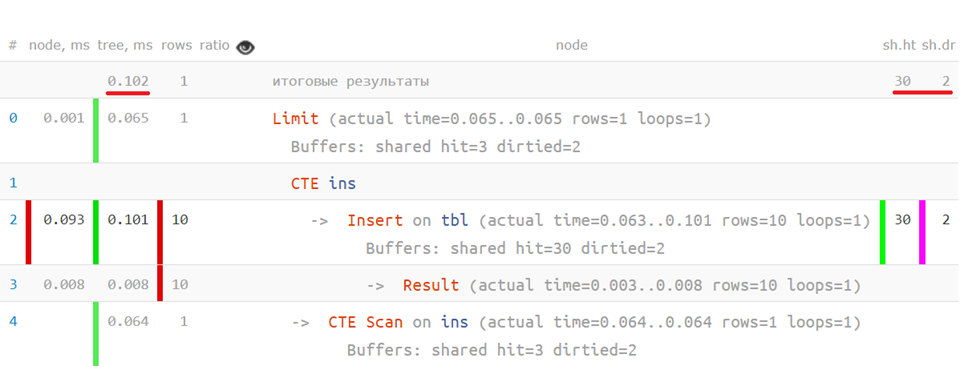
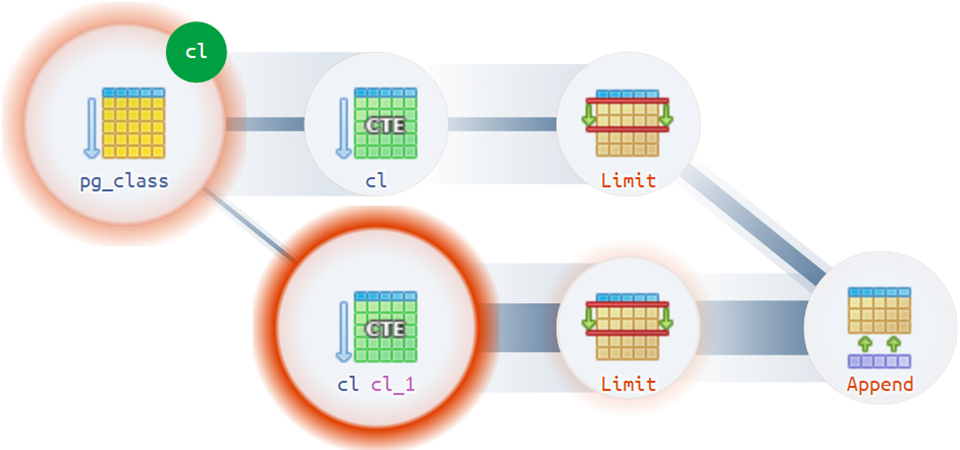
Correct analysis of CTE Scan during repeated calls to the same CTE or partial reads from wCTE correctly allocates time and resources to the nodes that actually consumed them.
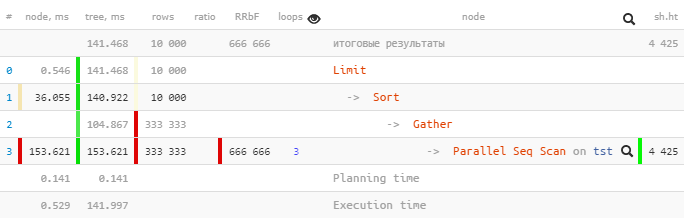
The analysis of parallel nodes summarizes, rather than averages, the execution time, taking into account the distribution over all involved CPU cores, to identify points for further optimization of the server load.
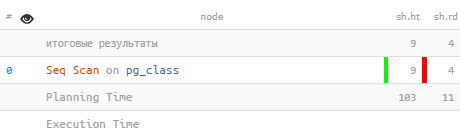
Parsing the additional Planning, Execution, JIT and Settings lines helps to understand how many resources were spent on preparing the plan even before its execution, and which of the possible optimizations and parameters were used for the query.
Different plan formats will be parsed, regardless of the way they were received: from the console with splitting rows across the screen width or as part of the log along with a query, in JSON, YAML format or export as CSV, with or without extra framing quotes copied from pgAdmin them.
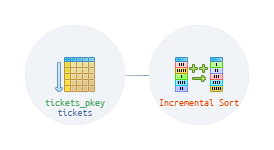
Recent versions of PostgreSQL generate plans with new node types Incremental Sort, Result Cache, Async Foreign Scan, and Index Skip Scan, but even these ones will not pose a problem parsing the query.
Enterprise fork support allows you to use all options for visualizing plans generated not only by vanilla PostgreSQL, but also by any of the specialized enterprise solutions based on it: Greenplum, Citus, TimescaleDB and Amazon RedShift.
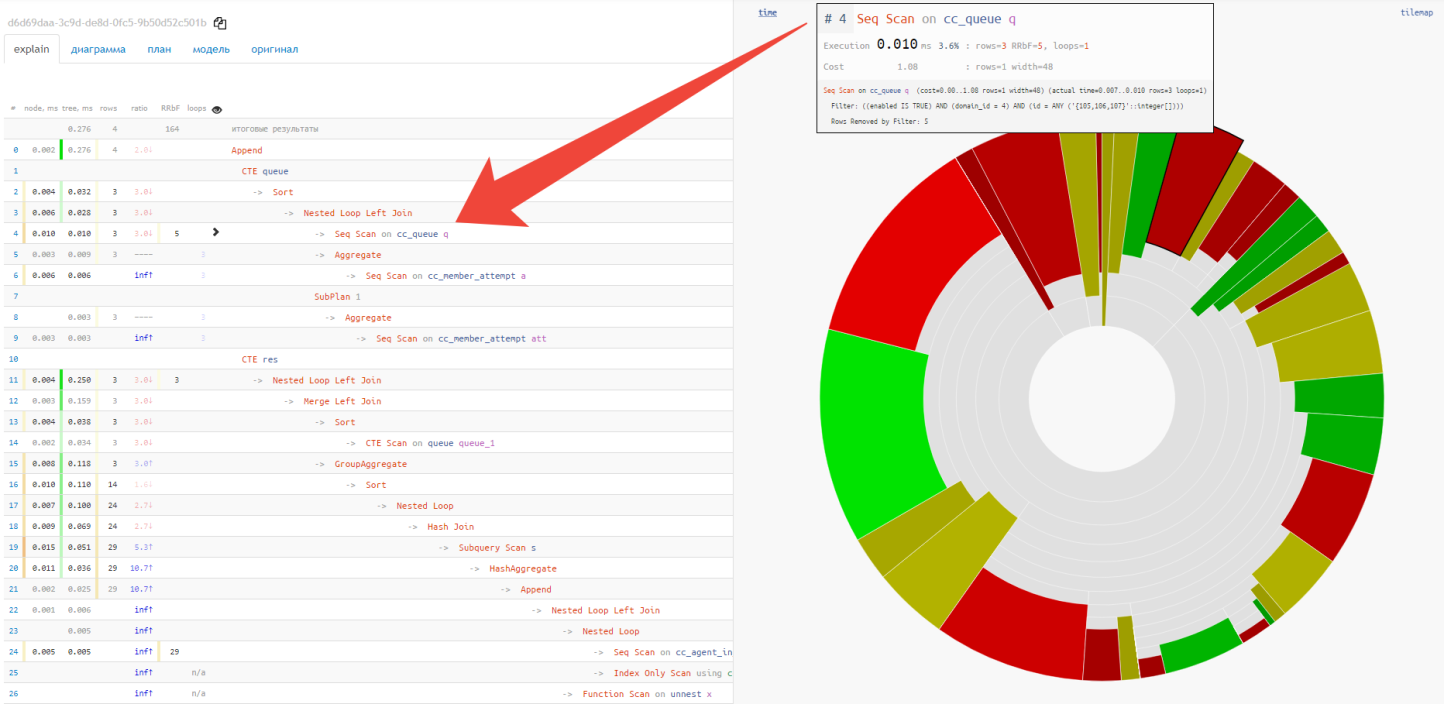
The pie chart helps to easily identify the dominant nodes and the approximate ratio of their shares in resource consumption.
Tiled visualization allows you to compactly evaluate the connection of nodes in large plans and highlight the section of the query where the problem has arisen.
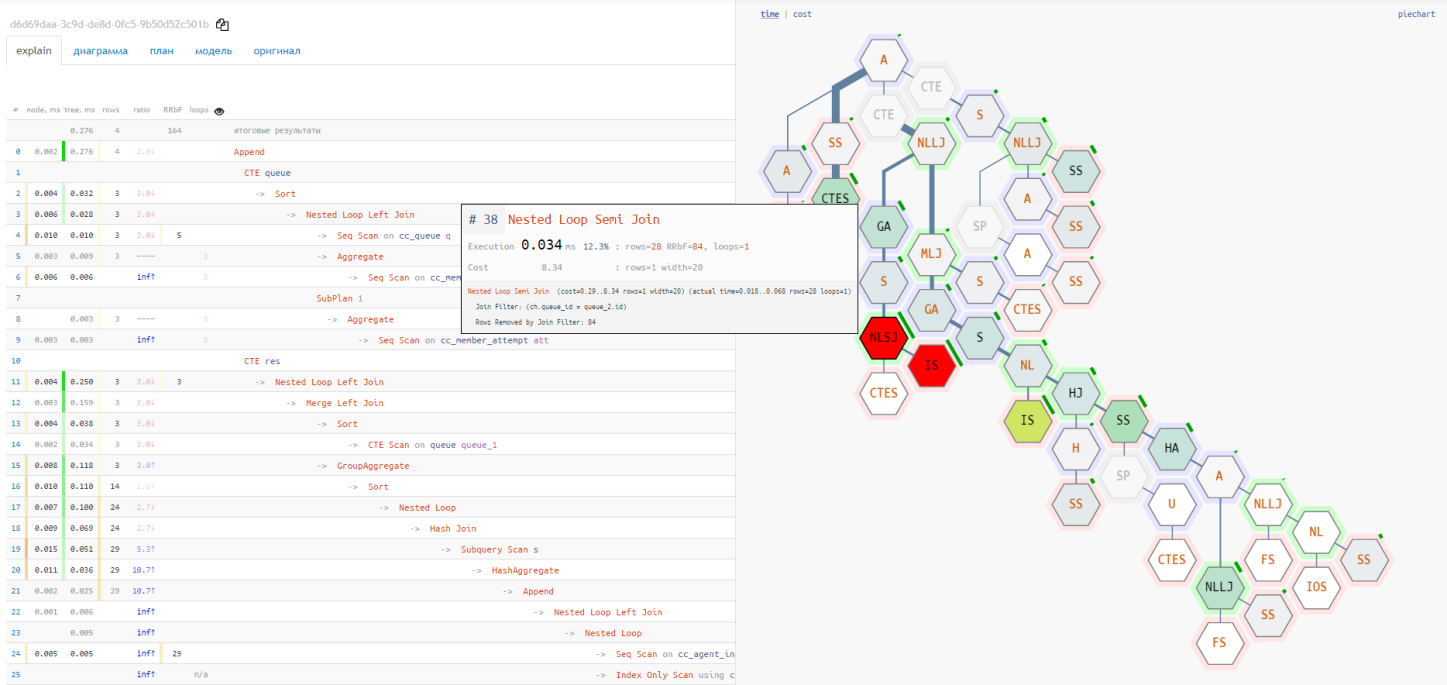
Scalable execution flowcharts provide a full glimpse of the future ”performance battlefield” and see the real dependencies of nodes and resource “flows”.
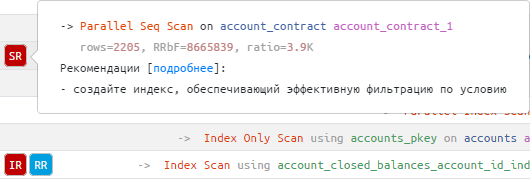
Smart recommendations, automatically generated based on analysis of the structure and resource metrics of the plan, will tell you exactly what a query performance problem is and how it can be easily resolved.
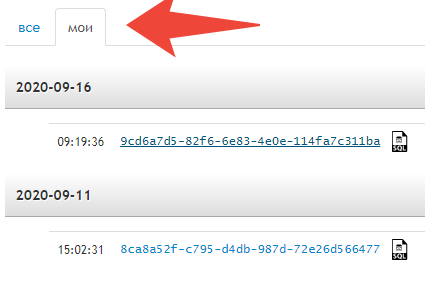
The personal archive is available only to you and contains all the plans that you analyzed, allowing you to instantly return to them, regardless of publication in the public archive.
An optimization tree with plan names helps you create the most efficient query variant or revert to one of the previous variants.

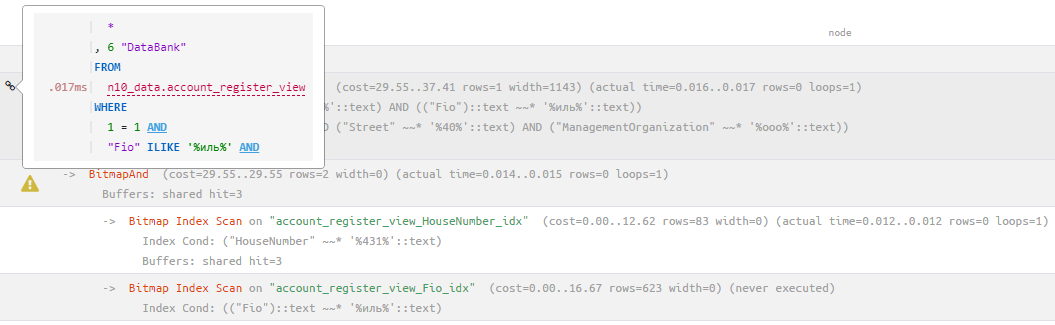
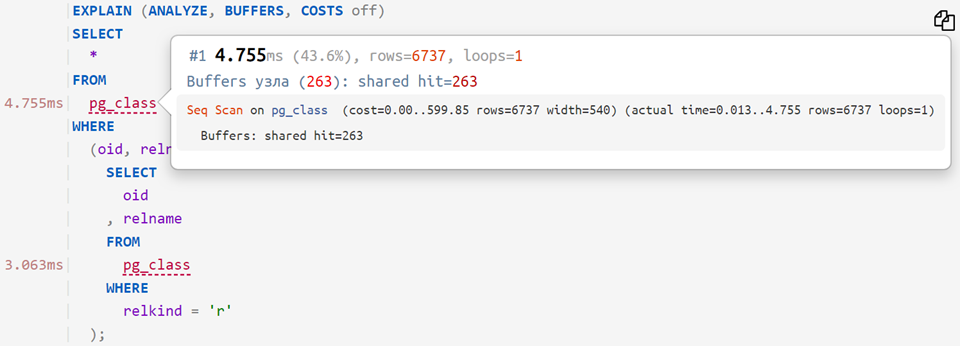
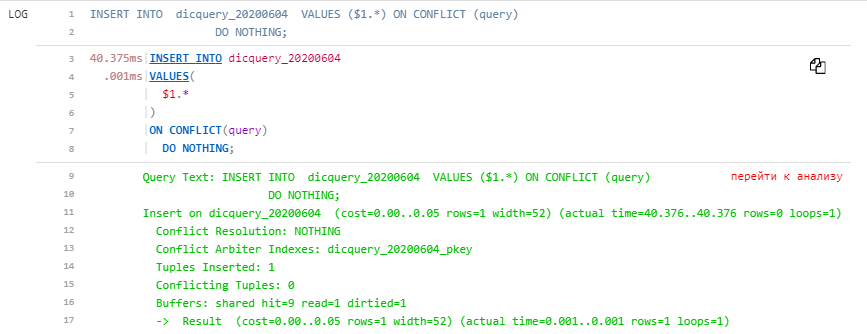
Matching a plan and a query makes it possible with one click to go from the problematic node in the plan to the corresponding point in the query and back, even if they occupy several screens.
The query normalizer into a single visual representation with a line-by-line profiler allows you to notice at a glance what exactly went “wrong”.